Home Assistant traces in Honeycomb
A friend of mine works at Honeycomb, which makes observability tools, and I wanted to see what their tool can do. So I tried it on one of my favourite hobbies: configuring Home Assistant. I’ve been connecting Home Assistant to other software lately (the last one was Detective Jev, which keeps watch over our house), and this is the next one.
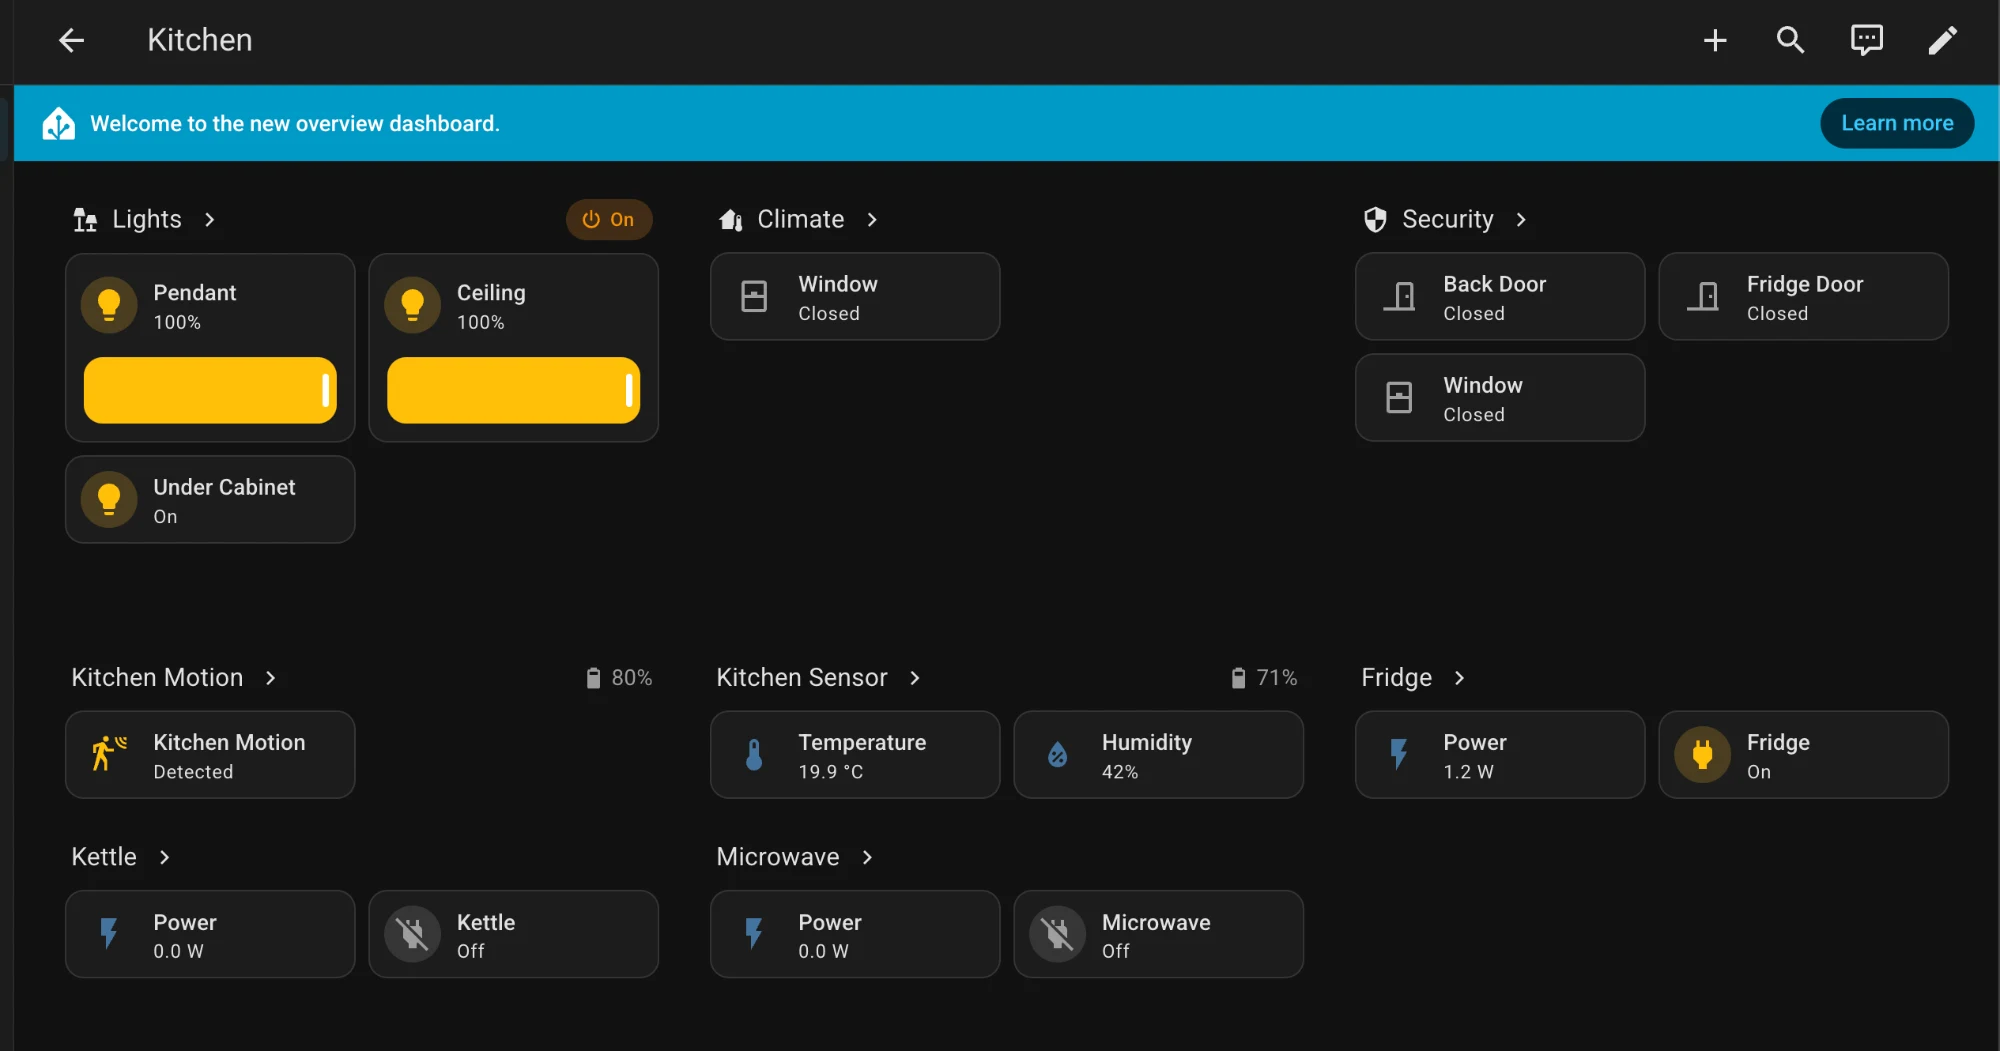
I created a custom integration, honeycomb-hacs, that sends what happens in Home Assistant to Honeycomb as traces. To have something to send before trying it on my own house, I also built a simulated home: 27 lights, motion and door sensors, blinds, plugs that report their power, a thermostat, a robot vacuum, and two made-up people who walk around setting things off. Its devices answer at different speeds, like real ones on different networks, and it hides a few problems on purpose for me to find in Honeycomb.
Spans and traces
A span is one thing that took time: it has a start, an end, and fields that describe it. A trace is a tree of spans that share one cause. Here is one run of an automation that closes the blinds at 11:30, to shade the house from the midday sun.
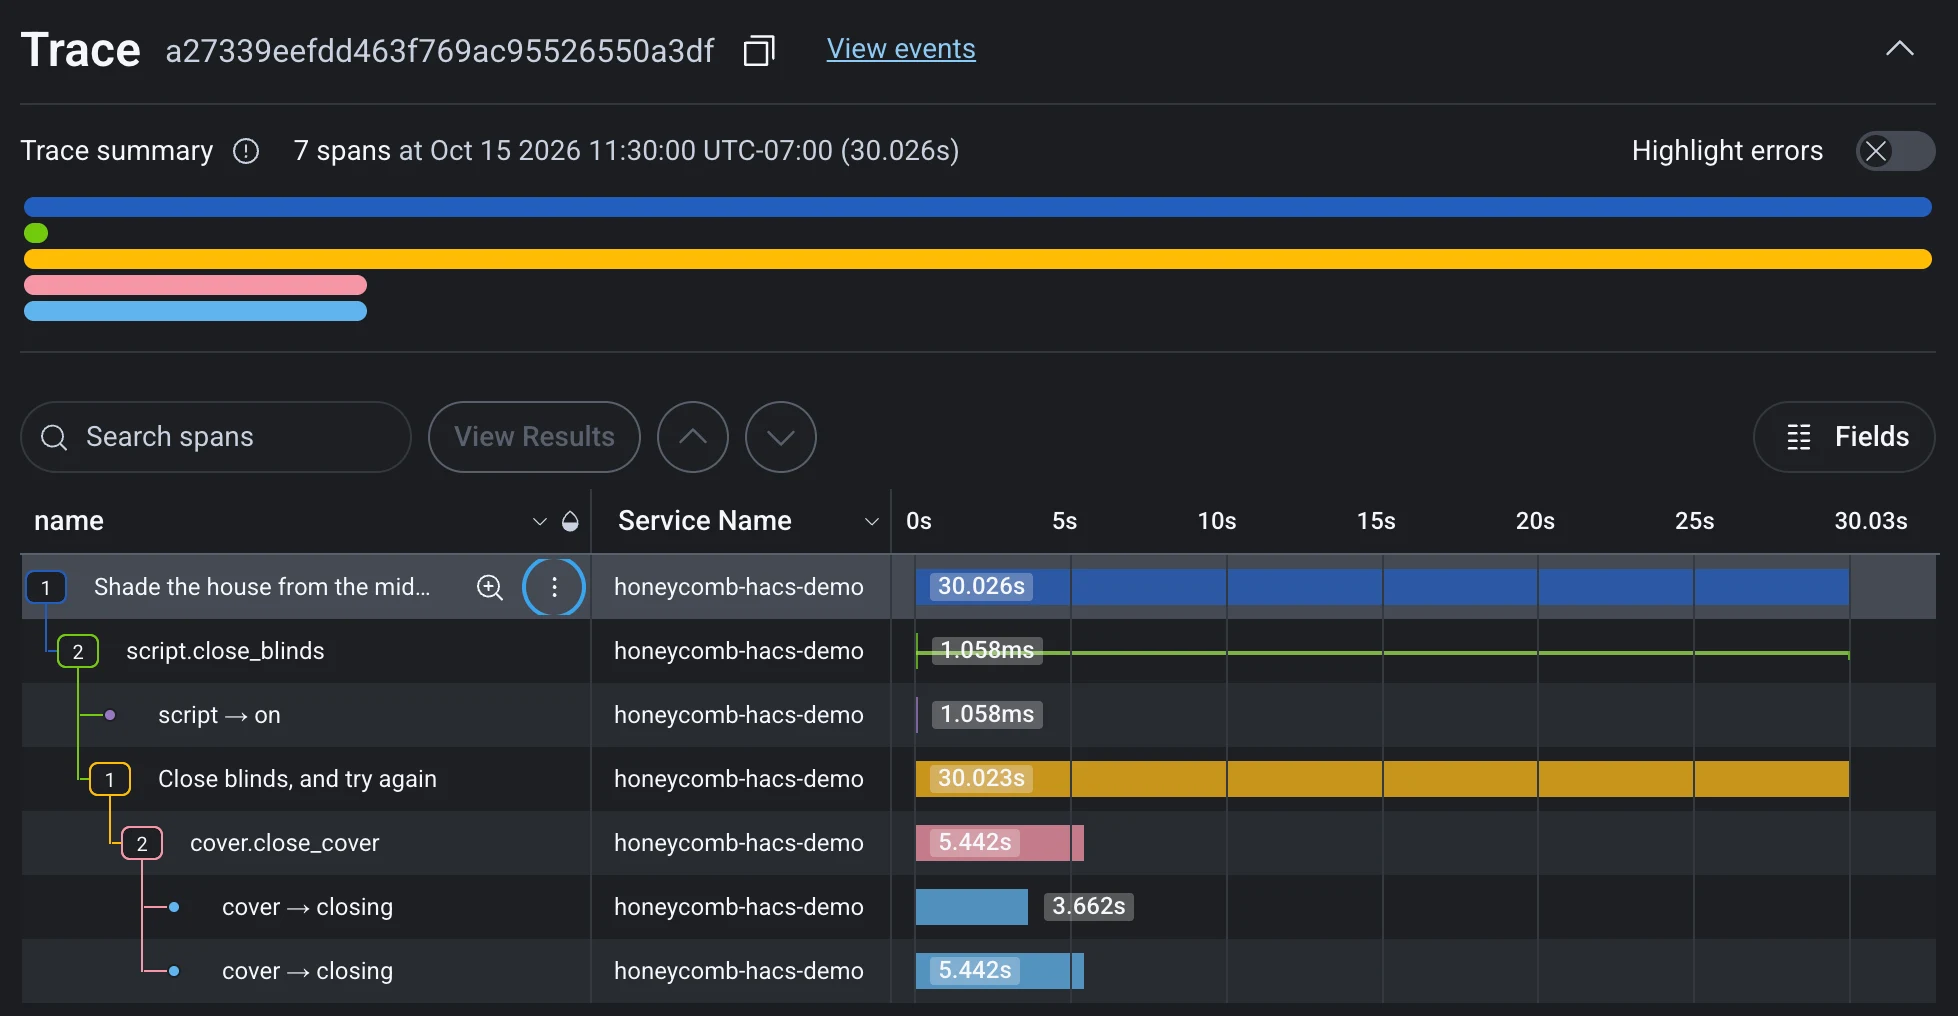
The run took 30 seconds, but the blinds started closing after 3.7 and 5.4 seconds. The rest is the script waiting to check that they closed, so it can try again if they didn’t.
Asking Canvas for correlations
One problem the simulation hides is the microwave. While it runs, the Zigbee lights on the ground floor slow down. At lunch, one command turned on four lights: the chandelier, on a different network, came on in 0.22 seconds, and the three Zigbee lamps took 5.7 to 6.2 seconds. Nothing in the lamps’ spans mentions the microwave, so you only find it by putting another device’s data beside theirs.
Honeycomb’s Canvas lets you ask for correlations like this one in plain words, and it’s pretty good at finding them already. I asked it whether it saw any correlations in my Home Assistant data from the last 24 hours that might point to a problem. It found three, and the first was the microwave:
Turning on the microwave slows the Zigbee lights. Zigbee light commands normally take ~600ms. They took 3–7s only during the four microwave runs (19:40, 19:58, 00:01 and 00:47 UTC). Your Clear Connect bulbs stayed under 260ms at those same moments, so it isn’t Home Assistant itself being slow.
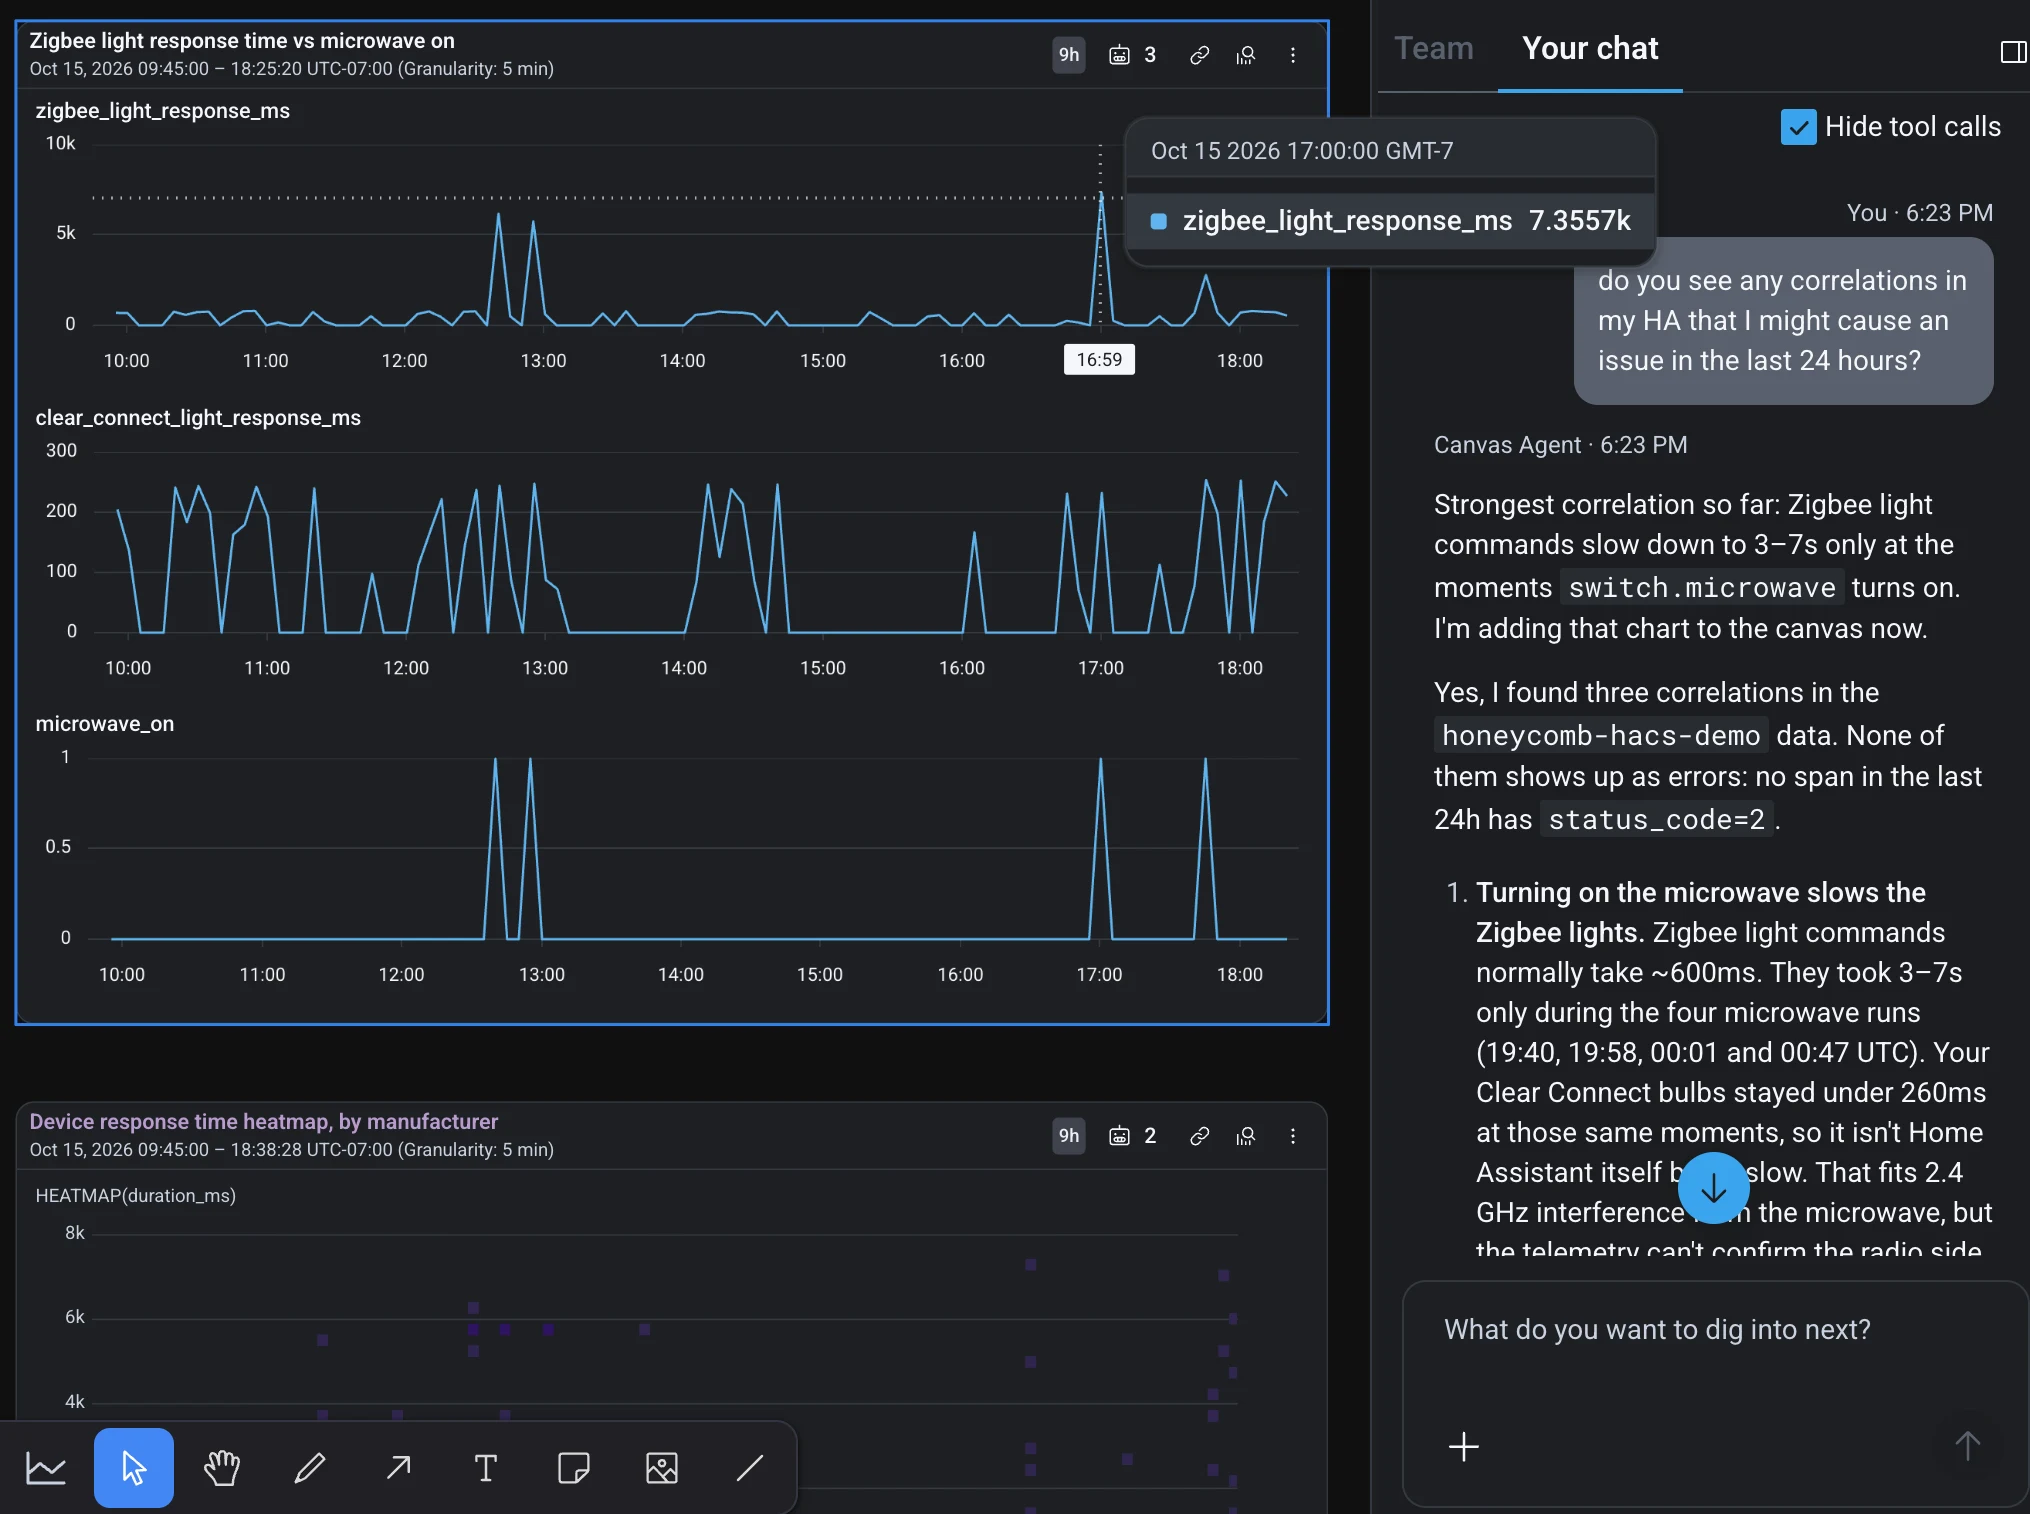
Canvas builds the page as you ask, adding widgets and content as it goes. It’s very similar to a dynamic UI I’m building for a product at work, so it was fun to see another company already doing it. I think dynamic content built by agents is the way of the future.
Heatmaps and BubbleUp
A heatmap of response times shows most of them under a second, and a scatter of slow ones above. Draw a box around some of them and BubbleUp compares every field of the spans in the box (yellow) with the rest (blue): first a short written summary, then one card per field, biggest differences first.
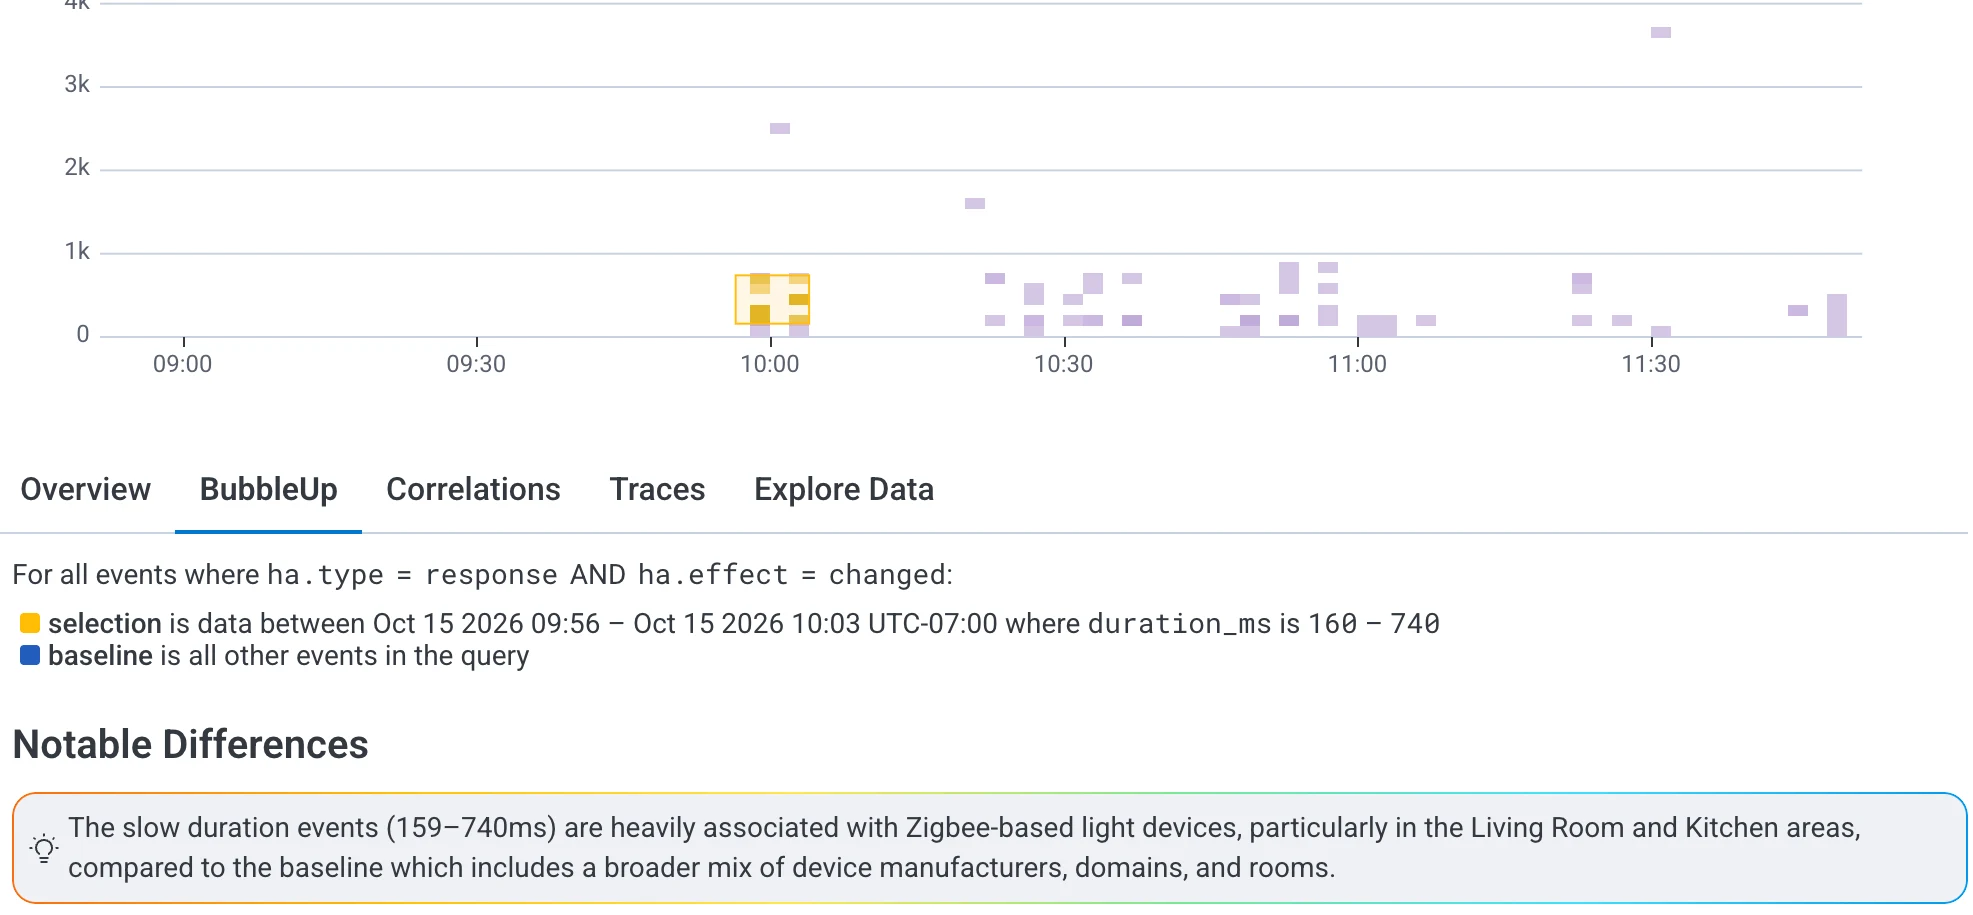
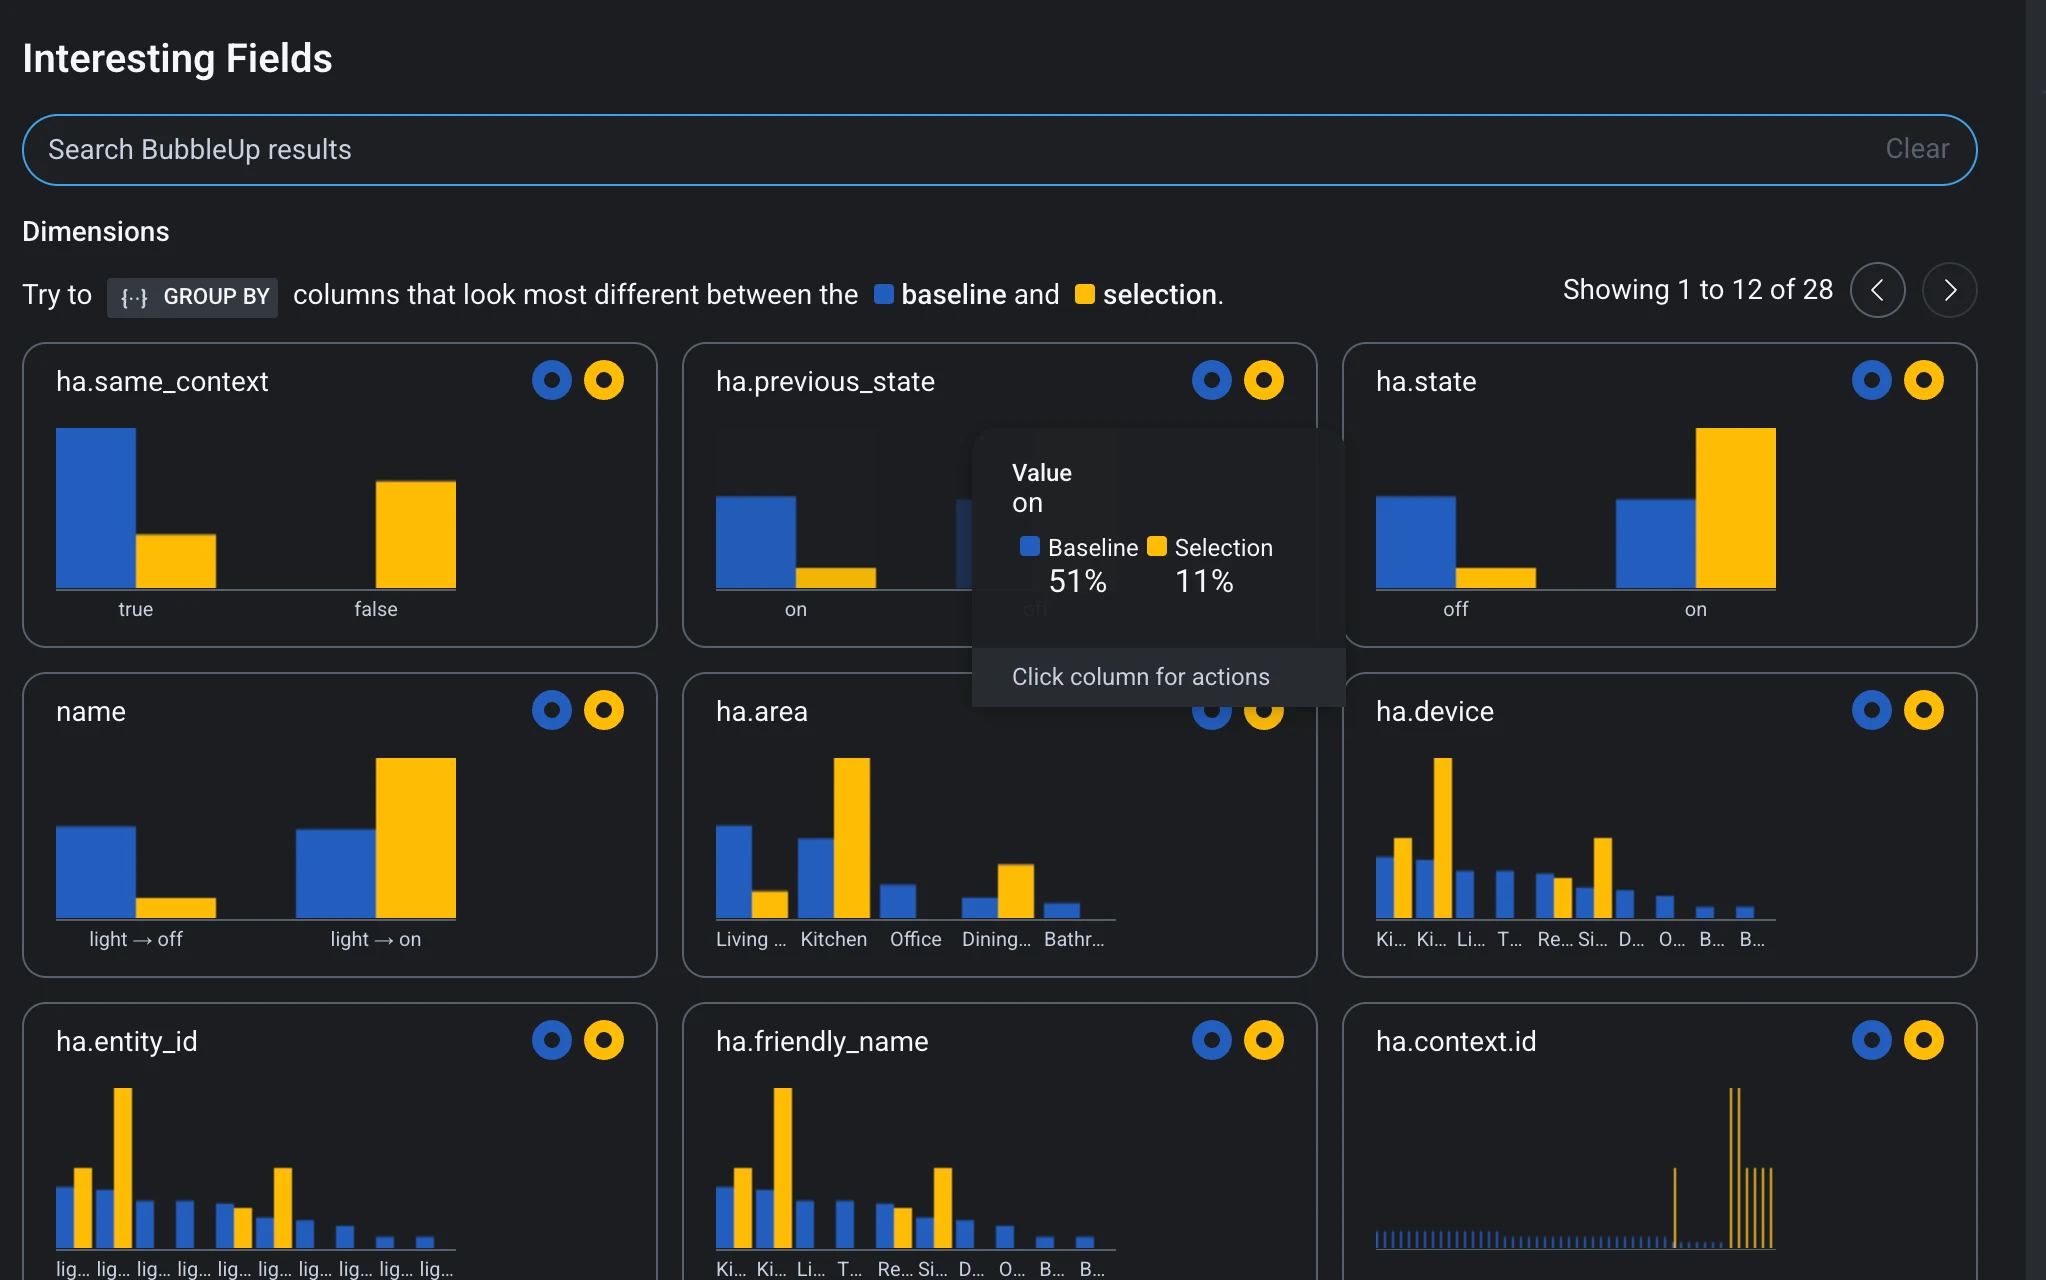
ha.area, the slow ones are mostly in the kitchen.The interesting part is going through the cards and seeing how the outliers differ from the baseline in each one. With so many fields in Home Assistant that’s a bit of work, because you have to pick out which ones matter and which are noise. There’s a fair bit of noise: three of those cards (entity id, friendly name and device) say the same thing.
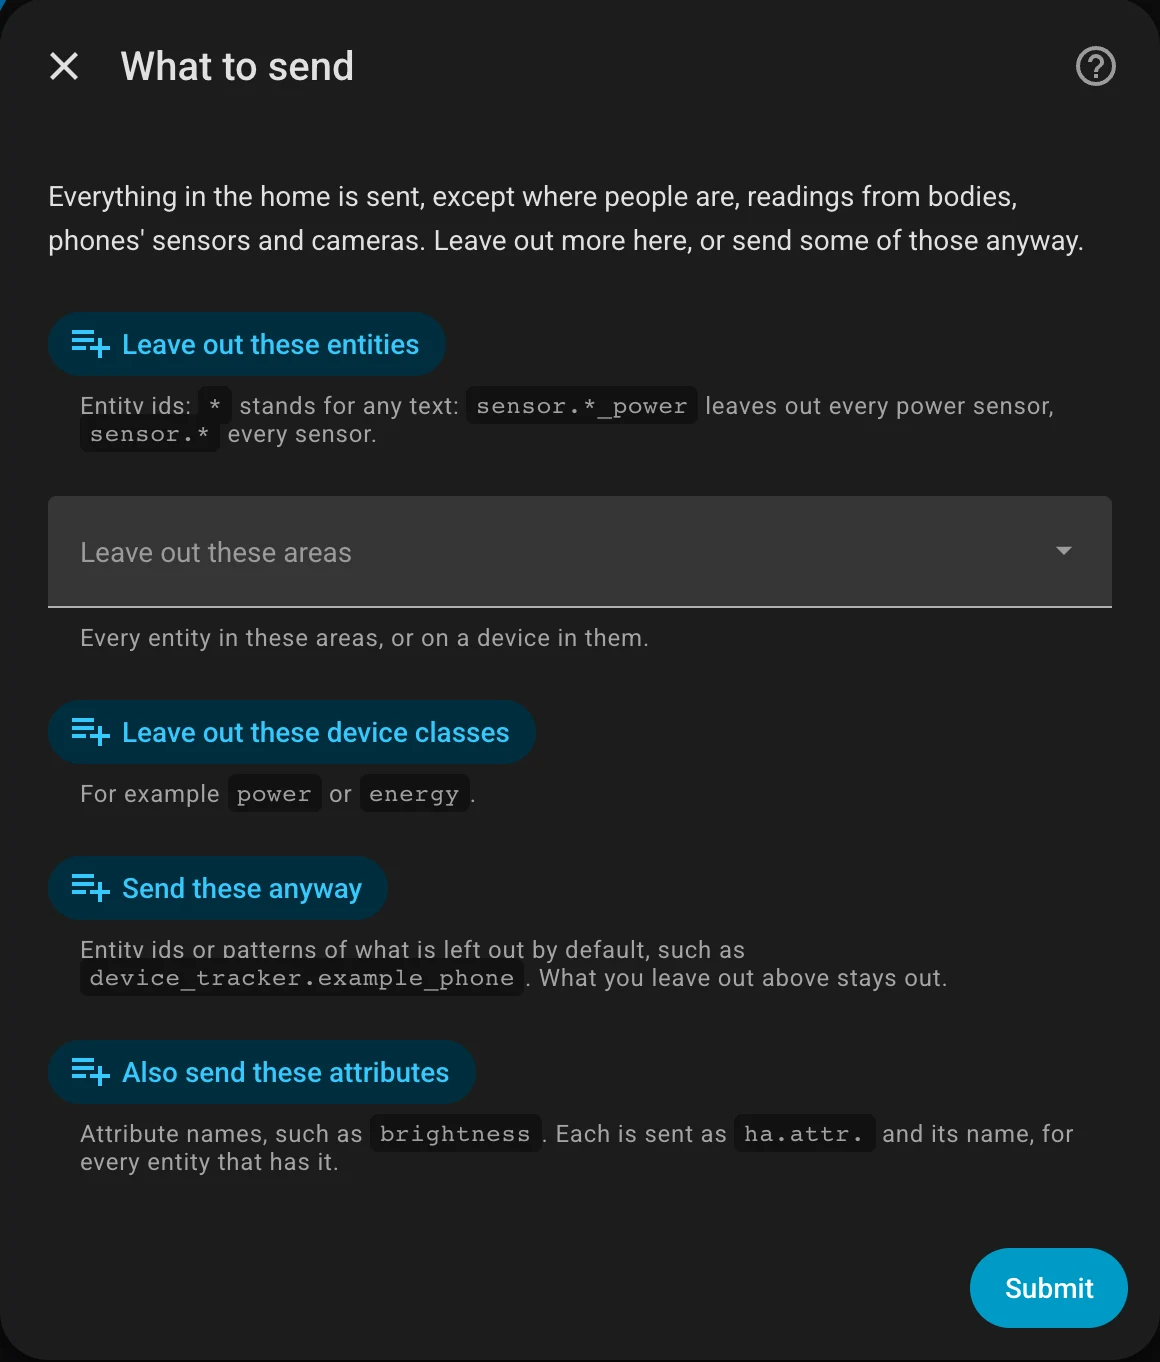
Version 0.1.0 of the integration is released on GitHub, and you can add it to your own Home Assistant through HACS as a custom repository. It sends everything except where people are, readings from bodies, phones’ sensors and cameras, and its options let you leave out more, or send some of those anyway.